 Figure contains an axes object. The axes object with title Population of the U.S. 1900-2000, xlabel Year, ylabel Millions contains a line object which displays its values using only markers." width="583" />
This example is an introduction to the Live Editor. In the Live Editor, you can create live scripts that show output together with the code that produced it. Add formatted text, equations, images, and hyperlinks to enhance your narrative, and share the live script with others as an interactive document.
Create a live script in the Live Editor. To create a live script, on the Home tab, click New Live Script.
Divide your live script into sections. Sections can contain text, code, and output. MATLAB® code appears with a gray background and output appears with a white background. To create a new section, go to the Live Editor tab and click the Section Break button.
Add the US Census data for 1900 to 2000.
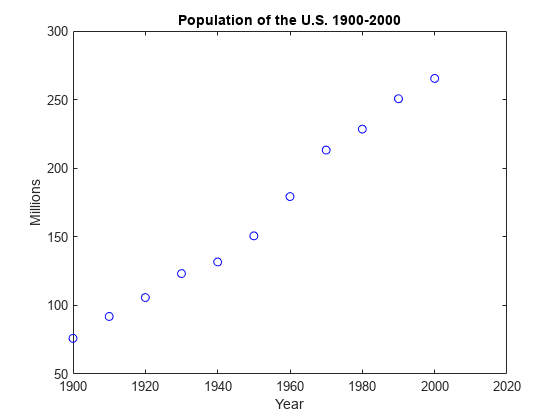
years = (1900:10:2000); % Time interval pop = [75.995 91.972 105.711 123.203 131.669 . % Population Data 150.697 179.323 213.212 228.505 250.633 265.422]
pop = 1×11 75.9950 91.9720 105.7110 123.2030 131.6690 150.6970 179.3230 213.2120 228.5050 250.6330 265.4220
Sections can be run independently. To run the code in a section, go to the Live Editor tab and click the Run Section button. You can also click the blue bar that appears when you move the mouse to the left of the section. When you run a section, output and figures appear together with the code that produced them.
Plot the population data against the year.
plot(years,pop,'bo'); % Plot the population data axis([1900 2020 0 400]); title('Population of the U.S. 1900-2000'); ylabel('Millions'); xlabel('Year') ylim([50 300])
Figure contains an axes object. The axes object with title Population of the U.S. 1900-2000, xlabel Year, ylabel Millions contains a line object which displays its values using only markers." width="583" />
Can we predict the US population in the year 2010?
Add supporting information to the text, including equations, images, and hyperlinks.
Let's try fitting the data with polynomials. We'll use the MATLAB polyfit function to get the coefficients.
The fit equations are:
y = a x + b linear y = a x 2 + b x + c quadratic y = a x 3 + b x 2 + c x + d . cubic
x = (years-1900)/50; coef1 = polyfit(x,pop,1)